How to Track Payroll Metrics: The Enterprise Guide for HR and Finance Leaders
The complete enterprise guide: eight payroll metrics with worked calculation examples, industry benchmarks, and the dashboard architecture that surfaces all of them without manual data pulls.

Table of contents
One unstitched HR platform to manage your entire workforce, from hire to rehire.
Talent Management solutions built for growing and exceptional people
Built-in compliance tools that update with changing regulations
Automated payroll, attendance, and leave management
Insights that help HR leaders make faster, better decisions

Key Takeaways
- Payroll metrics are quantifiable KPIs covering accuracy rate, processing time, cost per employee, overtime spend, error resolution time, and compliance score, all measuring payroll health every cycle.
- Enterprise HR and finance leaders in regulated industries (BFSI, manufacturing, healthcare) benefit most from structured metric tracking, given multi-jurisdictional compliance and high workforce complexity.
- Manual tracking via spreadsheets introduces errors and delays: Integrated payroll platforms with built-in dashboards automate data collection and surface anomalies in real time.
- ZingHR's unified HCM platform, powered by ZingZeroTAP and Ghrowth.ai, its agentic intelligence engine, consolidates payroll, time-tracking, leave, and statutory compliance into a single system across 35+ modules on one codebase and one database.
- A consistent review cadence prevents small issues from compounding: Every pay cycle for accuracy and errors, monthly for cost metrics, quarterly for strategic trends. Book a ZingHR demo to see role-based dashboards in action.
Payroll is one of an enterprise’s highest operating costs, but many HR and finance teams still track it through lagging reports, exception logs, and month-end reconciliations.
Without a disciplined view of payroll accuracy, cycle time, cost per employee, overtime spend, and correction volume, leaders see problems only after they hit payslips, compliance filings, or employee escalations. Strong payroll metrics give teams a way to spot leakage early, tighten controls, and protect trust in one of the few enterprise processes every employee notices.
The cost of getting it wrong is significant. Deloitte's 2025 Global Payroll Benchmarking Survey, focused on enterprises with 25,000 to 240,000 employees, identified business expansion into new jurisdictions and adapting to regulatory changes as the top cost drivers for large enterprise payroll teams.
The same report found 74% of organisations are using or implementing cloud-based payroll technologies, with adoption highest in APAC at 81%, making structured metric tracking essential for enterprise organisations operating across multiple geographies and regulatory environments.
The guide below breaks down the payroll metrics every HR and finance leader should track, explains how to calculate and benchmark each one, and shows how an enterprise-grade unified HCM platform turns raw payroll data into board-level intelligence.
8 Essential Payroll Metrics Every Enterprise Should Track
The table below summarises the core payroll metrics covered in this guide, along with the formula, review frequency, and the type of organisation gaining the most from each. Use it as a quick reference when designing your payroll dashboard or analytics layer.
Eight enterprise payroll metrics with formulas, review cadence, and best-fit organisation type.
Each metric was evaluated for measurability, relevance to regulated enterprises, and actionability within modern payroll and HCM platforms. The goal is to give HR and finance leaders a balanced, practical framework for payroll performance tracking.
1. Payroll Accuracy Rate
Payroll accuracy rate is the foundational metric for payroll health. Every enterprise processing payroll should track it, regardless of size or industry. The percentage of payslips issued without errors in a given pay cycle reveals whether your underlying data, calculation rules, and process discipline are working, or whether something has quietly broken.
Why It Matters
Errors include incorrect gross pay, wrong tax deductions, missed overtime, duplicate payments, and misapplied leave balances. For enterprise organisations in BFSI, manufacturing, or healthcare, where thousands of employees may be paid across multiple entities and jurisdictions, even a small percentage of errors translates into significant rework, compliance exposure, and erosion of employee trust.
Each payroll error typically requires investigation, correction, and sometimes an off-cycle payment, all consuming HR and finance time. In regulated industries, inaccurate statutory deductions can trigger penalties and audit flags. Use ZingHR's enterprise HR platform to surface accuracy in real time rather than retrospectively.
How to Calculate Payroll Accuracy Rate
The formula:
Worked example: if your organisation issues 5,000 payslips in a month and 40 contain errors, your accuracy rate is (5,000 − 40) ÷ 5,000 × 100 = 99.2%.
A drop to 97% the following month (150 errors) signals something changed: new hires not onboarded properly, a tax table update missed, or a process breakdown during data collection.
A target of 99% or higher is common for mature payroll operations. Organisations falling below 98% typically find that root-cause analysis reveals a small number of repeatable issues fixable once identified.
How ZingHR Tracks It
ZingZeroTAP, ZingHR's zero-touch payroll engine, validates payroll inputs against predefined rules (tax slabs, PF calculations, gratuity thresholds, leave balances) before payroll is finalised. Discrepancies are flagged automatically, letting payroll teams resolve issues before payments are processed rather than after.
2. Time to Run Payroll
Time to run payroll exposes bottlenecks in your payroll process: slow data collection from departments, manual reconciliation steps, approval delays, or system limitations. Multi-entity organisations and payroll teams seeking to reduce cycle time and free up capacity gain the most from tracking the metric closely. Pair the data with workforce management capabilities to identify which integrations would deliver the biggest cycle-time gains.
Why It Matters
Every hour spent running payroll is an hour not spent on strategic HR or finance work. Long processing times also increase the window for last-minute changes and errors. Tracking time to run payroll helps justify investments in automation and system integration.
Organisations running ZingHR's unified HCM platform typically find consolidating time-tracking, leave management, and payroll into a single system eliminates the handoff delays, inflating processing time.
How to Measure It
Log the date and time when payroll input is locked (all variable data submitted and validated). Log the date and time when the final payment is approved. Calculate elapsed time. Track the metric every pay cycle and chart it over 6 to 12 months to identify trends.
Benchmark considerations: Cycle time varies by organisation size, pay frequency, and complexity. A small organisation processing monthly payroll for 200 employees might complete the cycle in 2 to 4 hours. An enterprise with 10,000+ employees across multiple states or countries may take 3 to 5 business days. The goal is consistent reduction over time as automation replaces manual steps.
How ZingHR Tracks It
ZingHR's payroll module logs each stage of the payroll cycle (data collection, validation, calculation, approval, disbursement) with timestamps. Payroll administrators see a real-time progress dashboard and can identify which stage consumed the most time, enabling targeted process improvement.
3. Payroll Cost per Employee
Payroll cost per employee measures how much your organisation spends to process payroll for each employee, including payroll staff salaries, software licensing, outsourced services, printing, and compliance filing costs.
The metric separates the cost of running payroll from the cost of payroll itself (wages and benefits), giving finance leaders a clear view of operational efficiency.
Finance leaders and CFOs evaluating the efficiency of the payroll function benefit most from tracking it through a unified HCM analytics layer.
How to Calculate It
The formula:
What to include in total payroll processing cost:
- Payroll team salaries (proportional to time spent on payroll tasks).
- Payroll software licensing and maintenance fees.
- Outsourced payroll service fees.
- Printing and distribution costs (if applicable).
- Compliance filing costs (tax filings, statutory returns).
- Cost of error correction and off-cycle runs.
Worked example: if your payroll processing costs total ₹30,00,000 per year and you have 3,000 employees, your payroll cost per employee is ₹1,000 per year. A rising figure should trigger investigation into whether headcount grew faster than process capacity, or whether error rates increased rework costs.
Why It Matters
Payroll cost per employee is the metric justifying technology investments. When you can demonstrate a reduction from ₹1,200 to ₹800 per employee after implementing an integrated platform, the ROI case for the board is concrete and defensible.
For RevOps and HR leaders building consolidated business cases, ZingHR's cost optimisation framework provides reference benchmarks.
4. Overtime as a Percentage of Total Payroll
Calculating and controlling overtime is one of the most persistent challenges in payroll management. Overtime as a percentage of total payroll measures how much of your total wage bill goes to overtime pay, providing a clear signal of workforce planning effectiveness, scheduling efficiency, and potential compliance risk.
Operations and HR leaders in manufacturing, retail, healthcare, and any sector with shift-based or hourly workforces should track it every cycle.
How to Track Overtime Metrics
The formula:
A rising overtime percentage often indicates understaffing, poor shift planning, or seasonal demand spikes not addressed with temporary staffing. In 2026, with labour cost pressures increasing across industries, the metric has become central to board-level workforce cost discussions.
What to monitor:
- Total overtime hours per department, location, and employee category.
- Overtime cost as a percentage of total payroll spend.
- Trend analysis: is overtime rising, stable, or declining over 6 to 12 months?
- Distribution: is overtime concentrated in a few departments or spread broadly?
When 80% of overtime is generated by two departments, the solution is likely a staffing or scheduling fix concentrated in those areas, rather than an organisation-wide policy change. ZingHR's manufacturing vertical solutions surface the distribution automatically, eliminating manual data pulls.
Why It Matters
Uncontrolled overtime inflates labour costs, increases burnout and attrition risk, and in some jurisdictions triggers compliance obligations (premium pay rates, mandatory rest periods). Organisations tracking overtime as a payroll metric can intervene proactively by adjusting schedules, approving temporary hires, or redistributing workloads before costs escalate.
How ZingHR Tracks It
ZingHR integrates time and attendance data directly into payroll calculations through its unified architecture. Overtime tracking is surfaced on dashboards filterable by entity, department, location, and employee category. Ghrowth.ai, its agentic intelligence engine, flags overtime anomalies and surfaces them for CHRO and CFO command centres before they compound into board-level concerns.
5. Labour Expense as a Percentage of Total Revenue
Labour expense as a percentage of total revenue is the macro metric connecting workforce cost to business performance, and the metric belongs on every board agenda.
The formula:
CFOs, CHROs, and finance leadership planning headcount, wage adjustments, and productivity initiatives should review the ratio monthly or quarterly. Ghrowth.ai's role-specific command centres surface it for boardroom review.
How to Calculate Labour Expense Ratio
Worked example: if your total labour cost is ₹50 crore and revenue is ₹200 crore, your labour expense ratio is 25%. A rise to 30% the next quarter without a corresponding revenue increase should prompt the board to understand whether the shift is driven by new hiring, wage inflation, overtime, or benefits cost escalation.
Why It Matters
The metric connects payroll directly to business performance. The connection lets finance and HR leaders have evidence-based conversations about headcount planning, wage adjustments, and productivity initiatives. In regulated industries where margins are tight, even a 2 to 3 percentage point shift in the ratio can have a material impact on profitability.
6. Payroll Error Resolution Time
Payroll error resolution time measures the average time it takes to identify, investigate, and correct a payroll discrepancy from the moment it is reported or detected. The metric directly affects employee trust. Few things erode confidence faster than a pay error taking weeks to resolve.
Payroll operations teams in enterprises where employee experience and compliance auditability are priorities should track it every cycle. ZingHR's employee engagement modules connect resolution time directly to satisfaction scores.
How to Measure It
Track the timestamp when an error is reported (by the employee, a manager, or the system), and the timestamp when the corrected payment or adjustment is processed. Calculate the average resolution time across all errors in a pay cycle.
Why It Matters
Short resolution times signal a responsive, well-staffed payroll function with good system access and clear escalation procedures. Long resolution times indicate process bottlenecks, unclear ownership, or system limitations preventing quick corrections. For organisations in regulated sectors, unresolved payroll discrepancies can become compliance liabilities if they involve statutory deductions.
How ZingHR Tracks It
ZingHR's payroll module includes a built-in query management workflow. Employees can raise payroll queries through the self-service portal, with each query timestamped and tracked through resolution. Payroll managers see average resolution times on their dashboard and can set SLA targets for different query categories.
7. Compliance Score
Compliance score measures the percentage of statutory payroll filings (tax returns, provident fund remittances, ESI contributions, professional tax, gratuity calculations) completed accurately and on time.
The formula:
Enterprises operating across multiple states or countries, and industries with heavy statutory requirements (BFSI, pharma, manufacturing), should treat compliance score as a board-level KPI. ZingHR's statutory compliance engine automates the calculation natively.
Why It Matters
In India, with the evolving Labour Codes framework, compliance complexity has increased. Organisations operating across states face different rules for minimum wages, PF applicability, and bonus calculations.
A compliance score below 100% means filings were late or incorrect, exposing the organisation to penalties, interest charges, and audit scrutiny. Regulatory non-compliance carries financial penalties, reputational risk, and in some cases personal liability for company officers.
Tracking a compliance score transforms statutory obligations from a checklist exercise into a measurable KPI with accountability.
How ZingHR Tracks It
ZingHR's payroll platform maintains a statutory compliance calendar with automated reminders for every filing deadline across jurisdictions. The system tracks filing status in real time and generates a compliance dashboard showing current-month score, historical trends, and upcoming deadlines. Ghrowth.ai surfaces compliance anomalies before deadlines lapse.
8. Direct Deposit Enrolment Rate
Direct deposit enrolment rate measures the percentage of employees receiving pay via electronic bank transfer rather than physical cheques or cash.
The formula:
While it may appear secondary, the metric carries direct cost implications. Organisations looking to reduce cheque-processing costs, improve payment speed, and modernise payroll disbursement should track it quarterly via ZingHR's payroll dashboards.
Why It Matters
Processing a physical cheque costs significantly more than an electronic transfer when you factor in printing, postage, reconciliation, and stop-payment handling. For organisations with dispersed or field-based workforces, common in manufacturing, logistics, and retail, high direct deposit enrolment also improves payment reliability and reduces payroll-related queries.
A low enrolment rate often signals onboarding process gaps (bank details not collected), employee resistance (especially in cash-heavy sectors), or system limitations. Tracking the metric helps payroll teams target the right interventions: better onboarding workflows, employee education, or digital payment partnerships.
How ZingHR Tracks It
ZingHR's employee self-service portal allows employees to submit and update bank details during onboarding or at any time. The payroll dashboard shows enrolment rates by entity, location, and employee category, helping teams identify pockets of low adoption.
Benefits of Tracking Payroll Metrics
Tracking payroll metrics turns payroll from a reactive cost centre into a strategic intelligence layer feeding board-level decision-making. The benefits cluster into five categories spanning cost, compliance, employee trust, process maturity, and workforce strategy. Each benefit compounds when surfaced through Ghrowth.ai's role-specific command centres rather than scattered across spreadsheets.
1. Cost Control and Financial Visibility
Tracking payroll metrics like cost per employee, overtime percentage, and labour expense ratio gives finance leaders a granular, real-time view of where payroll spend is going and why.
Instead of reviewing payroll as a single line item on the P&L, structured metrics support drill-down analysis by department, entity, geography, and employee category. The visibility is the foundation for evidence-based headcount planning and wage budgeting.
2. Compliance Risk Reduction
For enterprises in BFSI, pharma, and healthcare, payroll compliance is existential. Tracking compliance scores, filing timeliness, and accuracy of statutory deductions transforms compliance from a reactive firefight into a proactive, auditable process. Organisations monitoring these metrics every cycle catch issues, such as a missed PF remittance or an incorrect professional tax deduction, before they become penalties.
3. Employee Trust and Retention
Payroll accuracy and error resolution time directly affect employee experience. Deloitte's 2025 Global Payroll Benchmarking Survey found 88% of organisations now have or are developing a global payroll strategy, a near 40% increase since 2018, reflecting the rising board-level expectation for accurate, on-time, multi-country pay.
When employees see errors are rare and resolved quickly, trust in the organisation increases, and trust compounds into retention.
4. Process Improvement and Automation Justification
Metrics like time to run payroll and payroll cost per employee make the business case for process improvement concrete. When you can show payroll processing time dropped from 5 days to 2 days after implementing an integrated platform, or cost per employee fell by 30%, the ROI conversation with the board moves from theoretical to quantifiable.
5. Strategic Workforce Planning
Labour expense as a percentage of revenue connects payroll to business performance. Tracking the metric over time, alongside overtime trends and headcount changes, supports strategic conversations about productivity, staffing models, and investment in talent management. Payroll data, properly tracked, becomes workforce intelligence.
Key Features of Modern Payroll Metrics Software
When evaluating payroll analytics capabilities, the features below separate strategic platforms from transactional tools. Each maps directly to one or more of the eight metrics covered above. Pair feature evaluation with a review of ZingHR's AI-powered HCM architecture, which delivers them on one codebase and one database.
1. Real-Time Payroll Dashboards
A modern payroll platform should surface KPIs (accuracy rate, processing time, overtime, compliance score) on a single dashboard updated in real time. Static monthly reports fall short of what enterprise teams now require. Dashboards let payroll and HR leaders monitor metrics as payroll runs, with anomalies caught during processing rather than weeks later. Look for platforms allowing drill-down by entity, department, location, and pay period.
2. Automated Data Validation and Anomaly Detection
Manual review of thousands of payslips is neither scalable nor reliable. Effective payroll software validates inputs against predefined rules (tax slabs, statutory limits, leave balances, overtime thresholds) before calculations are finalised. Anomaly detection flags outliers, an employee with unusually high overtime, a department with a sudden spike in off-cycle payments, so teams can investigate before errors reach employees.
3. Integrated Time, Leave, and Attendance Data
Payroll metrics are only as accurate as the underlying data. Platforms integrating time tracking, leave management, and attendance directly into payroll eliminate the manual handoffs and re-entry, introducing errors and inflating processing time. For organisations in manufacturing and healthcare, where shift-based scheduling is complex, the integration is essential.
4. Statutory Compliance Engine
In India and other multi-jurisdictional environments, payroll software must handle PF, ESI, professional tax, gratuity, minimum wages, and bonus calculations across states and entities automatically. A built-in statutory compliance engine with a filing calendar, automated calculations, and audit trails is non-negotiable for enterprise organisations.
5. Configurable Reporting and Analytics
Beyond dashboards, payroll teams need the ability to generate custom reports for specific audiences: detailed error logs for payroll operations, cost-per-employee trends for finance, and labour expense ratios for the board. Look for platforms supporting scheduled report generation, export to BI tools, and role-based report access.
6. Employee Self-Service for Query Management
Payroll query resolution time improves dramatically when employees can view their payslips, check leave balances, and raise queries through a self-service portal rather than emailing or calling HR. Self-service portals also reduce the administrative burden on payroll teams, freeing capacity for analysis and process improvement.
Why Enterprises Choose ZingHR to Track Payroll Metrics
ZingHR is an AI-powered Hire-to-Rehire platform built for enterprise organisations with complex workforce needs. Where legacy payroll systems treat payroll as a standalone function, its unified HCM architecture consolidates payroll, time and attendance, leave management, statutory compliance, and workforce analytics into a single system on one codebase and one database, eliminating the data silos and manual handoffs undermining payroll accuracy and inflating processing time.
For organisations in BFSI, manufacturing, healthcare, pharma, and other regulated industries, ZingHR delivers the compliance engine, multi-entity support, and board-level analytics that generic payroll tools cannot.
With 1,200+ enterprise clients, 2.8 million active users, 35+ modules, and 12 purpose-built vertical solutions, ZingHR's payroll intelligence is tested at scale in production across India, MEA, and SEA.
- ZingZeroTAP, the zero-touch payroll engine: Runs real-time reconciliation across every pay structure, location, and currency you operate in. The engine handles complex multi-state and multi-country compliance without manual intervention, surfacing accuracy, time, and cost metrics every cycle.
- Ghrowth.ai, its agentic intelligence engine: Sits above payroll data to deliver role-specific command centres. Payroll operators see detailed error logs. CHROs see workforce composition and compliance posture. CFOs see labour expense ratios and budget variance, all from one source of truth. The architecture turns payroll metrics from a manual exercise into an always-on intelligence layer.
- One employee record, one data layer: Time, attendance, leave, compensation, and statutory data all flow from the same record into every report, dashboard, and pay run. Reconciliation between systems disappears.
- Real-time dashboards over static reports: Drill-down by entity, department, location, and pay period lets HR and finance leaders monitor metrics as payroll runs.
LAPP, one of ZingHR's enterprise customers, captured the practical impact of consistent reporting and compliance after consolidating onto the platform. For payroll teams running reports across multiple entities and geographies, the move from fragmented data to unified intelligence is the difference between retrospective firefighting and proactive decision-making.
Turn Payroll Data into Board-Grade Intelligence
Tracking payroll metrics has become a baseline expectation for enterprise organisations operating across multiple geographies, entities, and regulatory environments.
The eight metrics above form the foundation, but their value depends entirely on whether they are surfaced in real time, attached to ownership, and connected to broader workforce and financial planning.
To see how ZingHR's unified HCM platform, ZingZeroTAP, and Ghrowth.ai turn payroll metrics into board-grade intelligence, book a demo with ZingHR.
Frequently asked questions (FAQs)
To track payroll metrics effectively, define a core set of KPIs (payroll accuracy rate, processing time, cost per employee, overtime percentage, error resolution time, compliance score) and measure them every pay cycle using reports from your payroll or HRIS system.
Enterprise organisations typically start with five foundational metrics: payroll accuracy rate, time to run payroll, total payroll cost as a percentage of revenue, overtime spend as a percentage of total payroll, and compliance score. These five KPIs cover the three dimensions mattering most at the board level.
Target a payroll accuracy rate of 99% or higher. Calculate this metric as (total payslips minus errors) / total payslips x 100. Count incorrect gross pay, wrong tax deductions, missed overtime, duplicate payments, and misapplied leave as errors. Conduct a root-cause analysis if the rate falls below 98%.
Payroll processing time tracks the full cycle from locked payroll inputs to approved payments. Start the clock once the payroll team has received, checked, and locked all variable data. Stop it when finance approves the final payout file, and payments are dispatched.
Payroll dashboards consolidate HR, time-tracking, and payroll data into real-time KPI visualisations to help teams quickly spot outliers. They provide role-based access: payroll operators view error logs, HR leaders track headcount and costs, and CFOs monitor labour expenses and compliance. Ghrowth.ai delivers these interfaces as role-specific command centres.
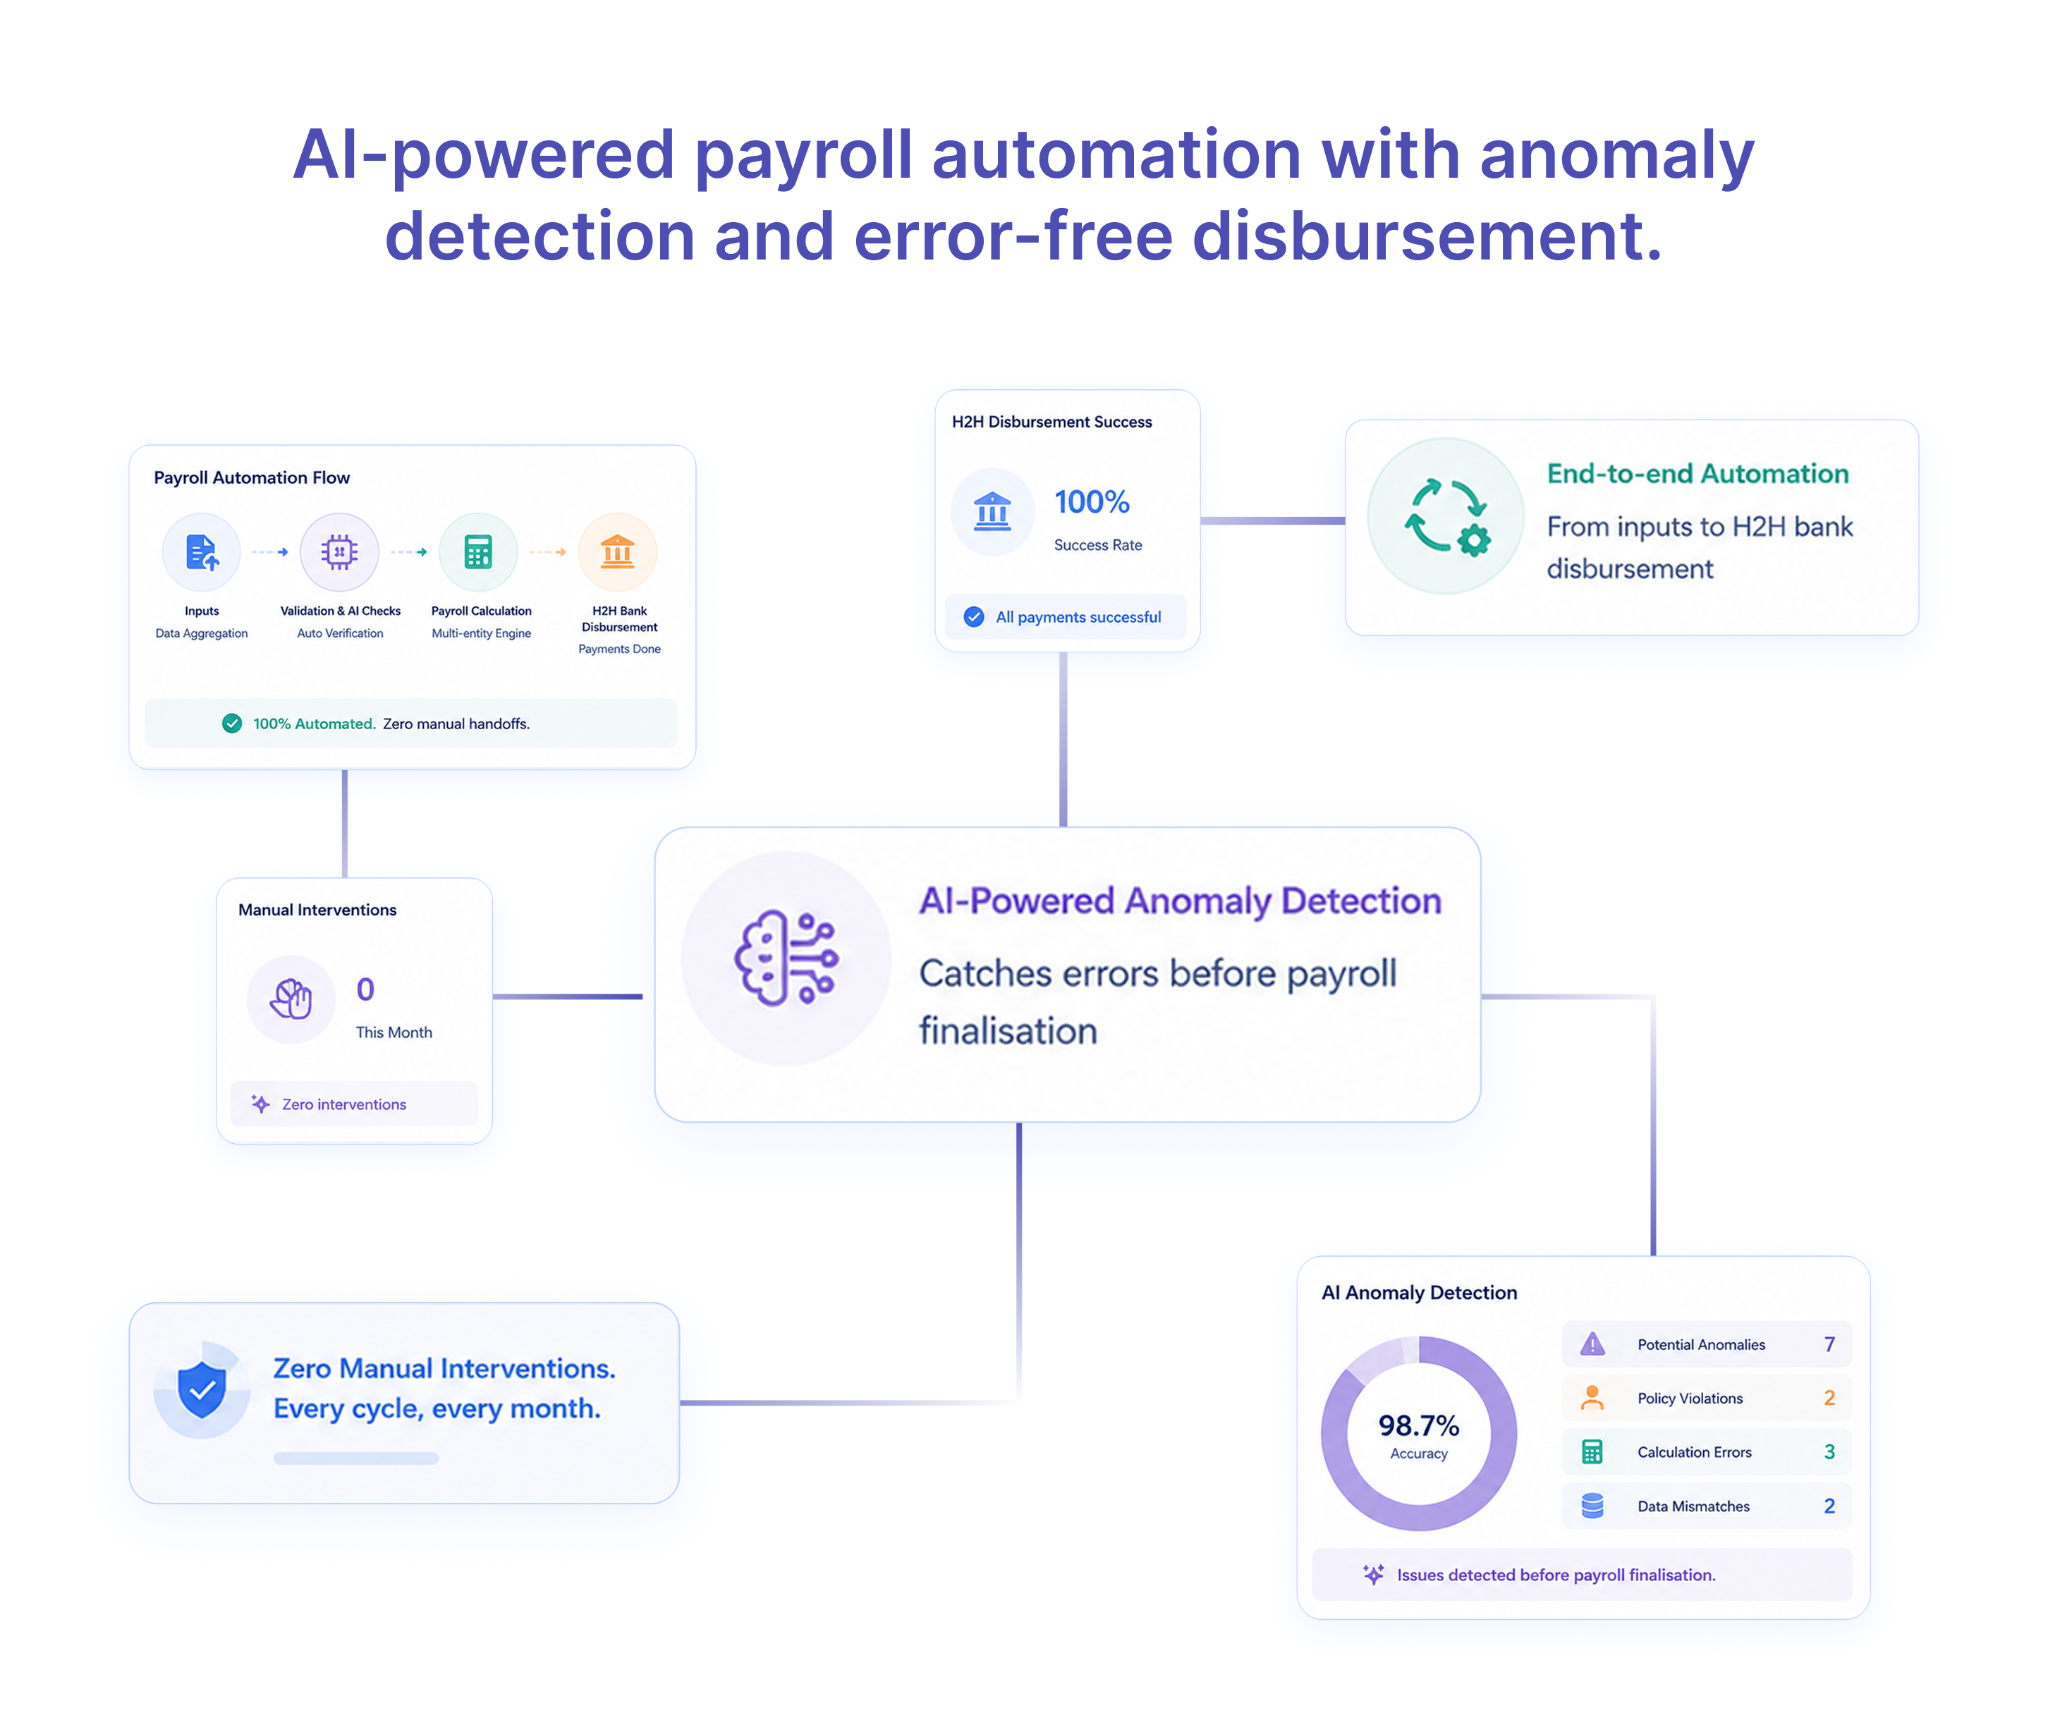
Automation tools centralise HR and time-tracking data to generate real-time payroll analytics. Platforms like ZingHR feature built-in validation to catch discrepancies before finalising payroll. They provide anomaly detection for unusual payments and automated alerts for statutory changes. This eliminates spreadsheet tracking, reduces manual errors, and calculates metrics automatically every cycle.
What to do next?
See ZingHR in Action
Join the 1,200+ enterprises that have replaced fragmented HR with one intelligent, future-ready platform. See ZingHR in 30 minutes.
Build the Organization You Want
Great HR drives retention, capability, and culture. ZingHR takes care of the operational layer so your people team owns the strategy.

Elevating Impact.
Defining Destiny
See how ZingHR's AI-powered Hire-to-Retire platform frees your CPO to lead with purpose and deliver the outcomes your Board is watching for


ZingHR is the AI-powered Hire-to-ReHire platform built for one purpose to remove every transactional layer of HR from your organisation, permanently.